
Have you ever had the thought “I wan’t to buy this stock, but I will wait for a cheaper price”?
On this article, I want to answer the question, whether it is useful to use limit orders for buying stocks. I didn’t find the information I was looking for anywhere, so I started to create my own database.
First I want to thank my friend Alexander Schenk for doing all the programming work in the Oracle-database!
Stocks on summer-sale, or not?
Many people think, that they can increase their return by setting a limit order with a discount to today’s stock price. It seems logical at first glance to buy a stock as cheap as possible. Who doesn’t want a discount of 5% or 10% or maybe 20%?
However, the world is not so easy. When observing prices of stocks, I can think of two theories:
- Winners and losers
If setting a discount, the order might never be executed and consequently, the stock will never be in your possession and so, the returns of the winning stock will never be yours. Another scenario might be a falling stock, where the limit order will be executed, however the stock is a losing stock and keeps losing after you bought it. So, if you buy stocks with a limit order, you buy the losers and miss the winners. - Regression to the mean
When a company maintains its intrinsic value, and the stock price fluctuates, the price will sooner or later go back to the intrinsic value. So, a stock price that went up will go down and one that went down will go up again. Then, a limit order would catch the stock at reduced prices, with the certainty that it will go up again.
Both theories can be right, but which prevails? Will there be different behaviors in the short run and in the long run?
In order to The following questions arise:
- When setting a buying price limit, what is the probability that the order will be executed, and within which period of time?
- If using limit orders, what is the expected return? And is the expected return higher than the return when using market orders?
Overview of the research procedure
To answer these questions, I analyzed data from all companies of the current composition of the S&P500 over a period of 45 years (if available) (From 1978 to 2023). I am aware that this set of data contains the “survivorship-bias”, as many former S&P500 companies were excluded from the index or filed for bankruptcy. Unfortunately, I have no data source for stock prices of these companies, so I have to use the current S&P500 companies for the analysis. Dividend payments were not considered in the return.
The database contains in total ~4 million rows of daily price data. (For analysis, I could only use the years from 1979 until 2017, as I had to look 6 years “into the future”)
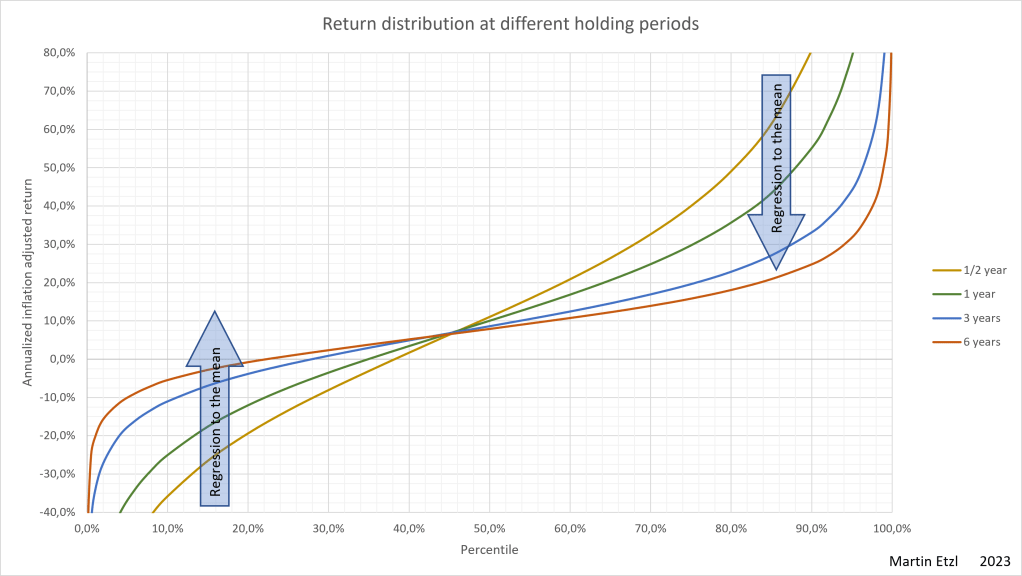
First, let’s have a look at the stock market return of the analyzed data. In the following graph 1, I performed a calculation of the percentiles of the annual return of different holding periods of a stock.
When looking at graph 1 at the 1 year holding period (orange line), we can see that the bottom 10% of the analyzed dataset have an annual return of less than -25% ant the top 10% (=90% percentile) have an annual return of more than 55%. At longer holding periods, the extreme values “normalize” and go towards the mean. This effect is called “regression to the mean” or “mean reversion” and can be senn clearly in this graph 1.
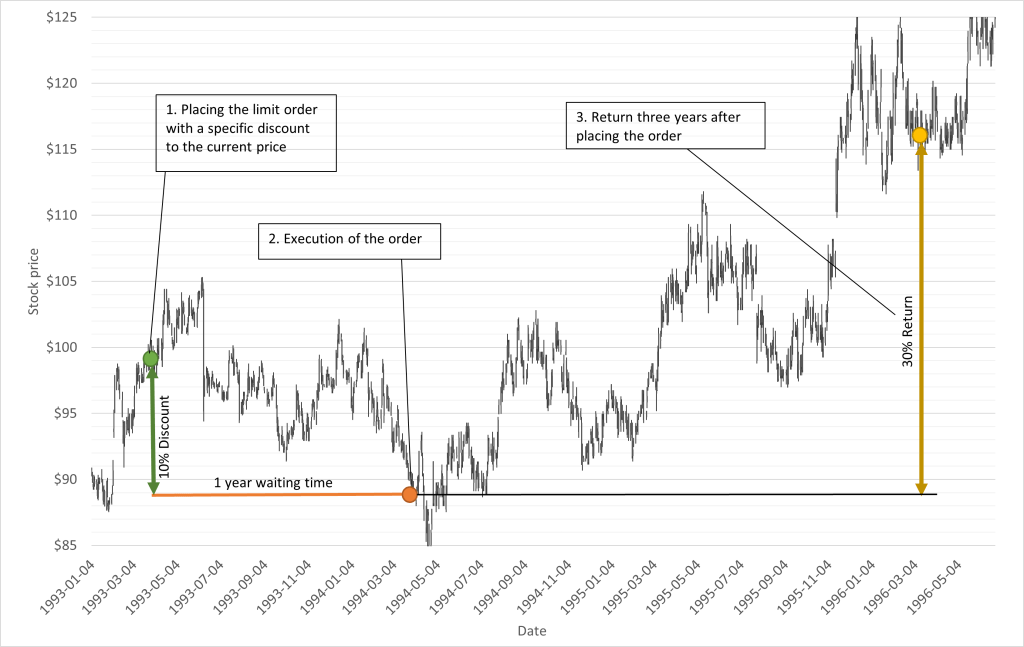
The next step is to investigate, how limit orders would have behaved. So, a limit order is placed (Graph 2: green point) with a certain discount. Then it takes a while, until the price reaches the limit and the order will be executed (orange point) (there is also the possibility, that the limit will never be reached). After possessing the share, the next interesting information is, how the return will be, let’s say in three year. (yellow point).
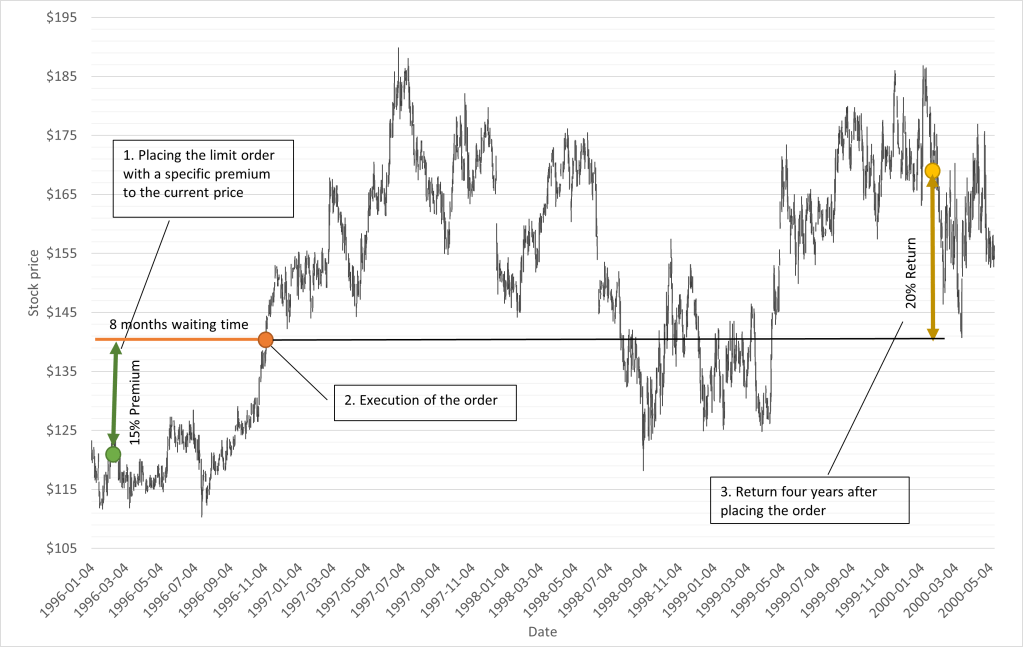
Graph 3 shows another scenario. This time, a order is placed, where the execution will take place only when the stock is 15% more expensive compared to the price when the order was placed. This seems counterintuitive because no one wants to pay more than necessary. Nevertheless, when we think about the theory 1, that was mentioned in the introduction, this strategy avoids losers and goes with the winners. Therefor it can be interesting to pay a premium.
When setting a buying price limit, what is the probability that the order will be executed, and within which period of time?
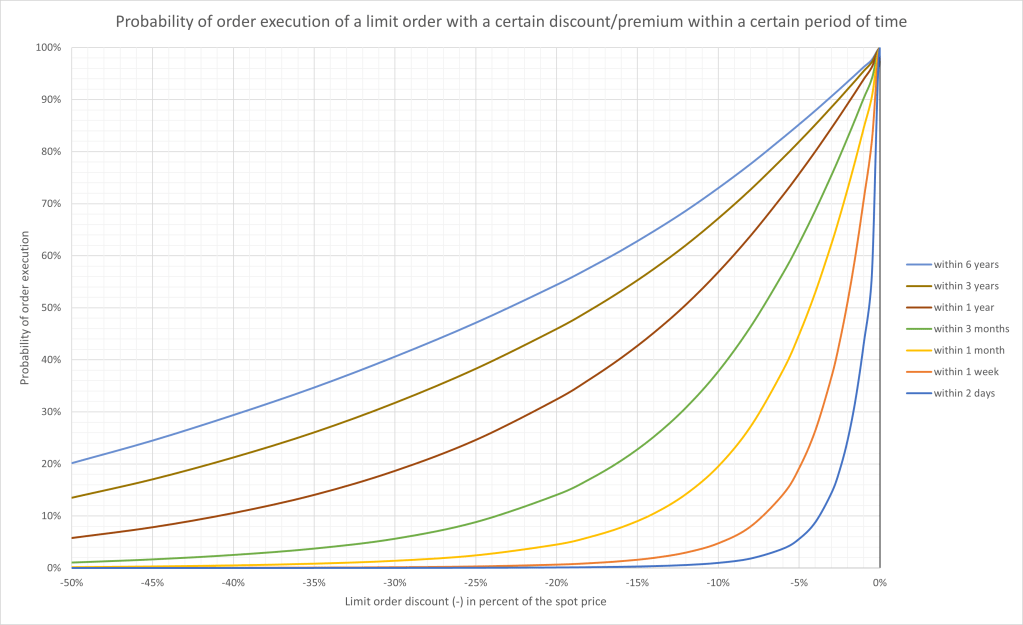
Now, after processing the data sets, the first question can be answered. In graph 4, the probability of order execution can be seen.
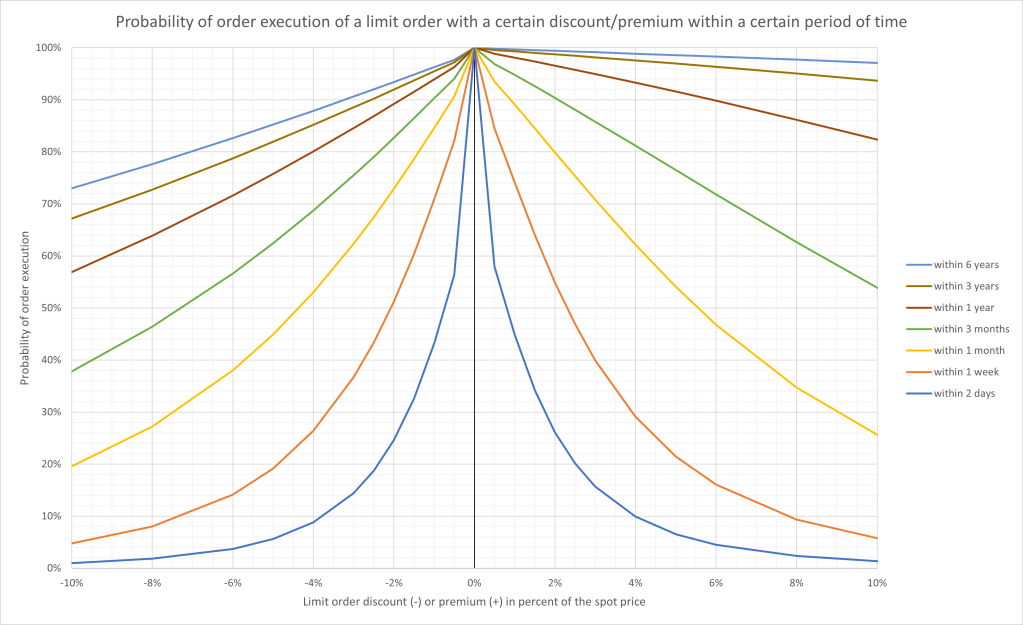
It is not surprising that the probability declines with an increase in the discount or premium. For example, there is only a 20% chance of a order execution within 1 month after placing a limit order with 10% discount. Please remember that this is the average probability within the analyzed period and the probabilities are varying from time to time.
Graph 5 and 6 illustrate the probabilities between 50% discount and 200% premium.

What is the expected return when placing limit-orders, compared to market-orders?
This is the important question, many people ask. And many people believe that, by using limit-orders, stop-loss-orders or other types of security mechanisms, the return of the portfolio can be increased or at least protected against losses.
Let me first explain, how to interpret the results:
- For better comparison, all returns are annualized
- All results are inflation adjusted (US consumer price inflation)
- If the price didn’t reach the limit, the cash held back for the purchase was depreciated for inflation
The result in graph 7 shows a clear result.
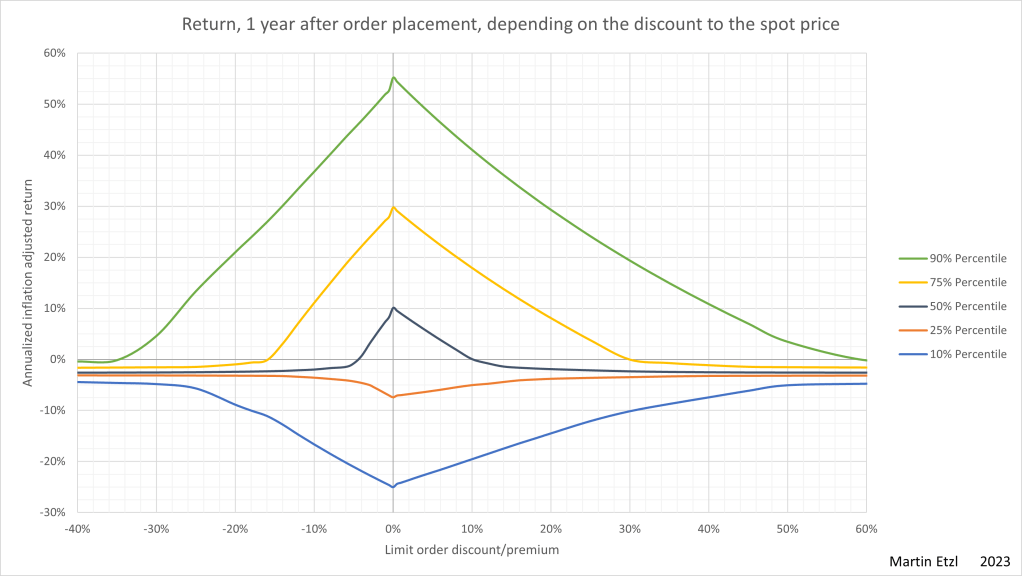
There is a significant reduction in the return, when limit orders are used! The reduction in return occurs on discounts as well as on premiums. The higher the discount value, the lower the return.
However, when it comes to the aversion of losses, limit orders are helpful. This effect can be seen on the 25% percentile and the 10% percentile.
One cause of the decreased return is the cash, waiting for the order execution, that is exposed to inflation. Neither the regression to the mean nor the buying losers/selling winners theory can be found clearly in the data.
What is the expected return, when only executed orders will be considered?
This question is just a theoretical question, as this purchasing strategy can not be done in reality. In reality, you need to have a pool of cash, in order to purchase stocks.
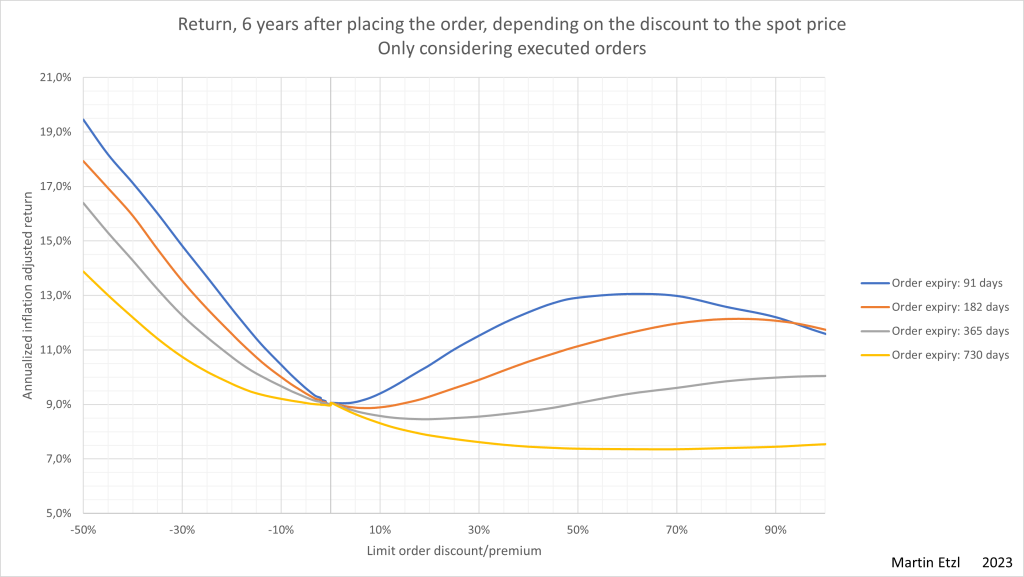
In this analysis, there is an increase in the return, when using a limit order. However, it is not possible to time the market and therefor this result can not be achieved.
Conclusion
It is interesting to know, how limit orders behave statistically and I was excited at looking at the results of this analysis. (I had already a premonition that the result would be like this, and now, I have the confirmation)
The fact that the best return can be achieved by directly and constantly investing in the market is valuable information for everyone who thinks, he can trick the market.
Nevertheless, the analysis presented in this article is useless in making good investment decisions. It will not relieve one from doing proper research and analysis of the companies and markets. There is no easy formula or automated way of successfully picking single stocks.
For technically interested persons: The database with 10.000 lines of SQL-code was programmed in oracle and now has a size of over 80 gigabytes. The statistical analysis was pretty complex, due to multidimensional views on the financial data. Therefor, the computation itself took several months. The programming was done within a few months on the evenings and weekends.
Disclaimer:
This analysis uses price data from the past that does not reflect the future.
The information on this article does not represent any advice for investment decisions.
