
Artificial Intelligence is currently a hot topic, having an impact in many areas, like image recognition, text generation and data science. One topic, I am curious about is, if and how artificial intelligence is doing with highly random and noisy data, as it appears in short-term-price-fluctuations on the stock market.
From programming courses in artificial intelligence (Keras and Scikit-learn) I already practiced some machine learning problems, like autoencoding, image recognition, text-generation and data classification. However, I was not satisfied with the approaches of stock market predictions, that were presented in several courses. There were either just random outcome on the one side or future-biased models with perfect predictions on the other side.
This gave me a reason to experiment myself. So here is my attempt on an “Investment recommendation bot” for short term investing (1 month period):
The model
The following graph shows the information flow beginning at the raw price data and ending with an executed recommendation.
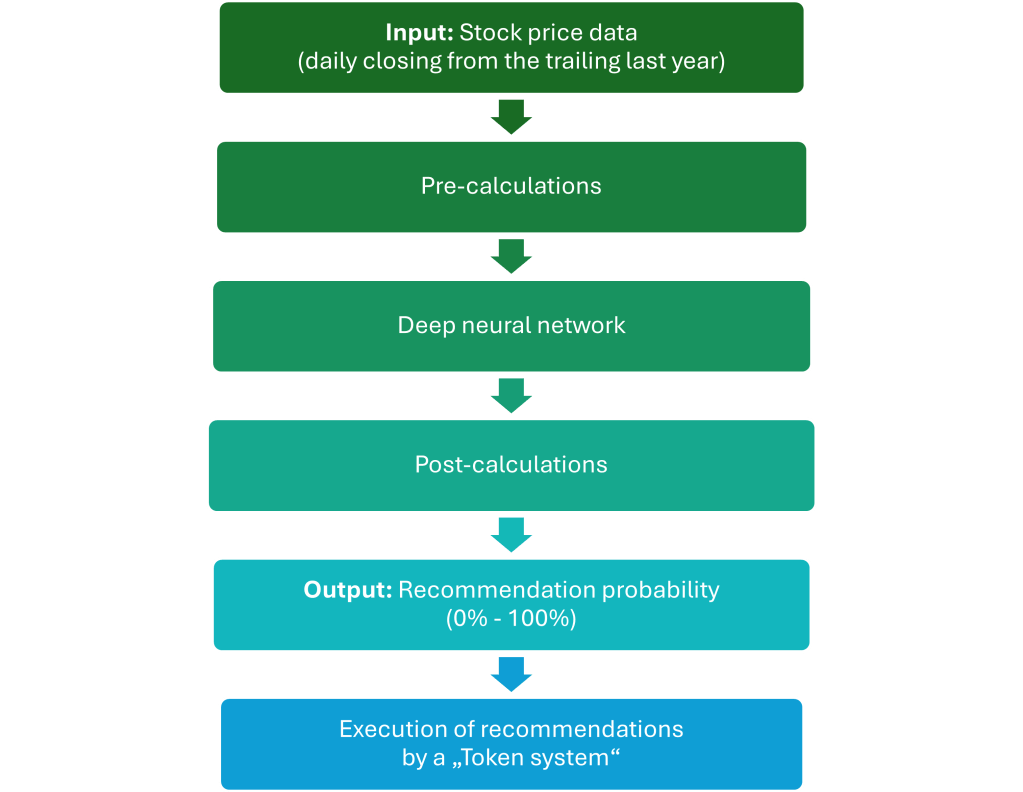
- Input data:
The input of the model is pure price data. For one prediction, the model needs the price data of the trailing last year. As an input, I take only price data (no fundamentals or other data), to demonstrate if the neural network is able to do something useful, even with just price data. - Pre-calculations:
Some pre-calculations and pre-datapoint-selections are necessary in order to feed the neural network with digestible data. Like a cook who is preparing the meal for the guest, I had to find the right recipe and the right spices for “cooking” the data for the AI-model. - Deep neural network:
Having experimented with different machine learning methods (Random Forest Regressor, Histogram Gradient Boosting Regressor,…) I found, the deep neural network worked best for this task of predicting prices. - Post-calculations:
The result of the model, an estimated value for the future, needs some post calculation in order to interpret the result and form a balanced recommendation. - Recommendation probability:
The outcome of the model is a recommendation ranging from 0% to 100%. Where 100% is a buy-recommendation and 0% a sell recommendation. - Token system:
In order to get a return, a prediction and subsequently a buy-recommendation is only half the story. There needs to be a system that invests into stocks. In my software this is working the following way: There is a cash depot, where money is taken from to invest in the recommended stocks. It would be too risky to invest the whole cash in one recommended stock. Therefore, the cash is equally spilt up into several piles of cash and assigned to a “Token”. This system works good for compounding returns, as wins and losses go back in one pot of cash and are assigned again to the Tokens. The number of Tokens is fixed (and optimized).
The result of the forecasting-model
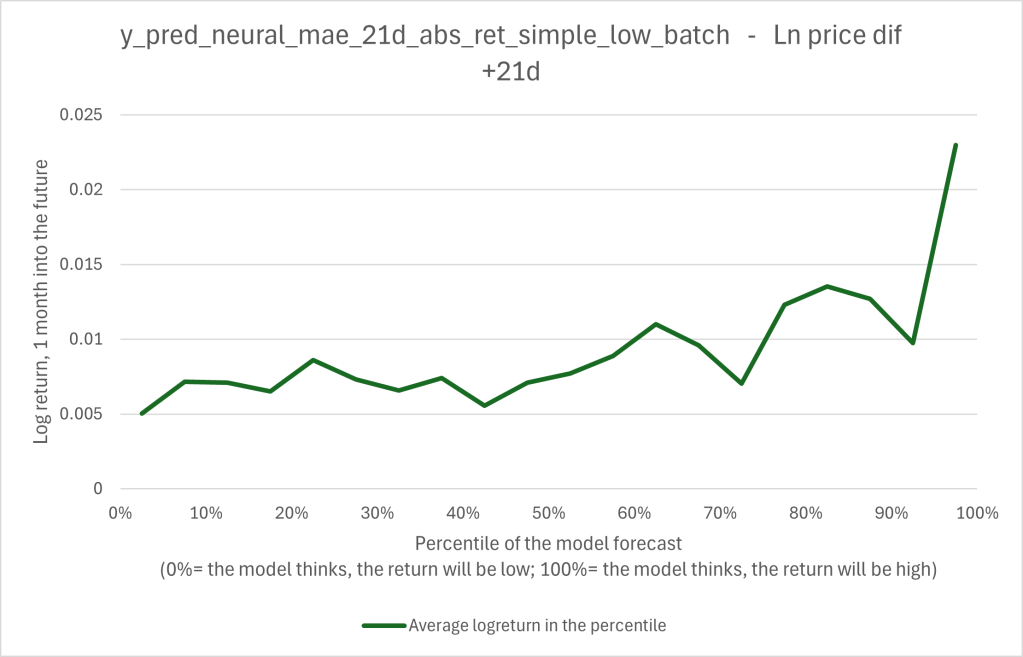
In the following graph 1 is the average result of the forecast. The x-axis shows the recommendation of the A.I.-model, ranging from 0% as a sell-recommendation to 100% as a buy-recommendation. The y-axis shows the real future 1 month log-return. With an increased forecast value, there is a trend towards higher returns visible. This means, that the model has the possibility to outperform the market. (This doesn’t mean that it will generate out-performance, as the recommendation also has to be put into action somehow)
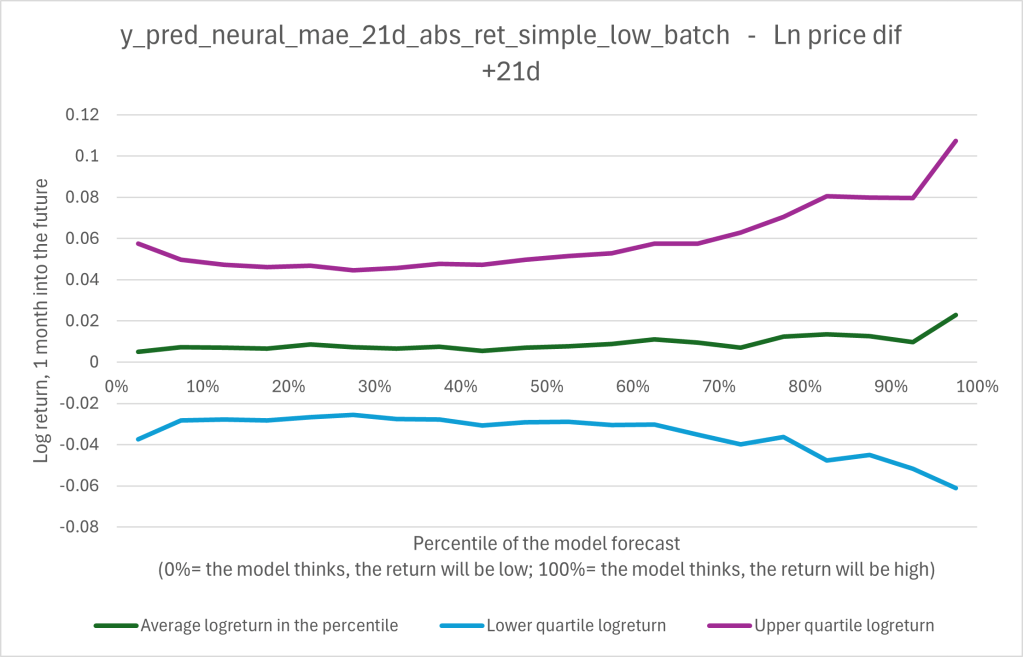
The average is not the full story. To better visualize the range of results, I added the lower and upper quartile to the following graph 2. There, it can be seen that the interquartile range varies along the x-axis. It seems as if the model recommends to invest in riskier stocks / situations, as the range widens, the higher the recommendation is.
The picture (as it was with the average) is not that clear anymore. Is it worth following the models recommendation and risking more?
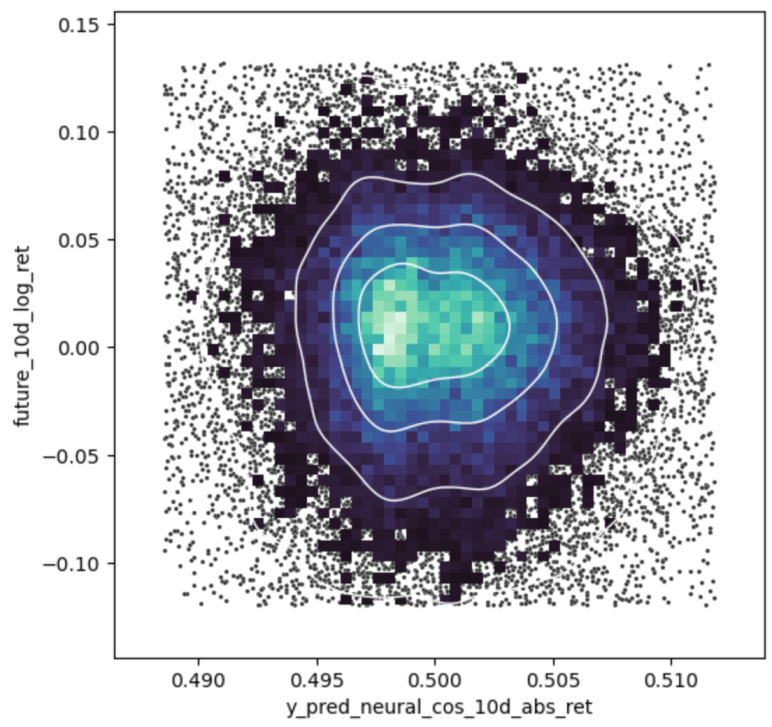
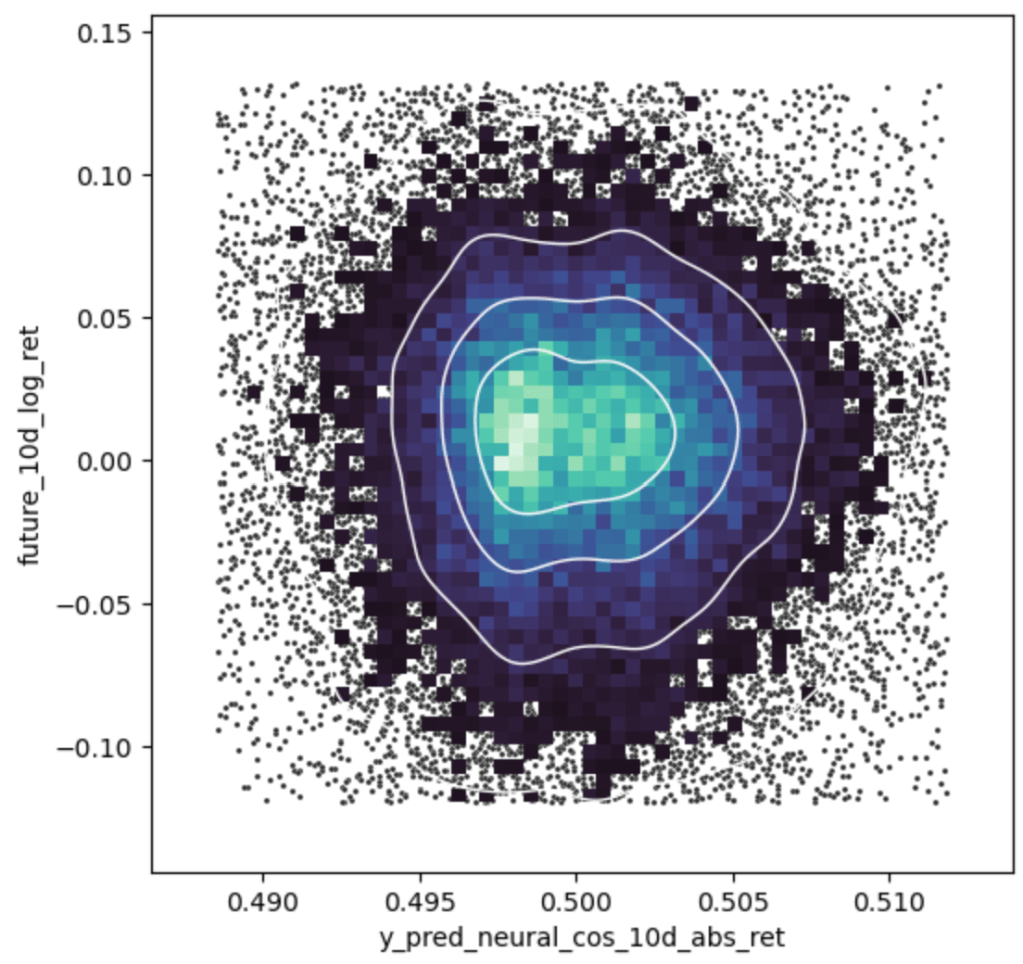
Another view of the recommendation is the following graph 3, where again the recommendation is on the x-axis and the return is on the y-axis. Here the randomness and the uncertainty of the models prediction can be seen. If the model could perfectly predict the future, the graph would be a straight line from the bottom left to the top right.
With all these nice forecasts and recommendations, the question whether to outperform the market has not been answered yet. This can only be answered by actually doing something in the market.
Result of the Trading-system
With the predictions of the forecasting model, my trading-system was fed and a test-run was conducted for the period between 2012 and 2023. What does this trading system do? The trading system has a several predefined number of tokens. If a recommendation occurs, the cash which is assigned to one token is invested into the recommended stock and 1 month later sold (as the forecast only looks 1 month into the future) the cash will be put back in the balance, ready for the next recommendation. I set a recommendation threshold of 70%. This means, when the model recommendation was 70% or higher, there was a buy-recommendation and the trading-system had the opportunity to buy the stock, if enough tokens are available.
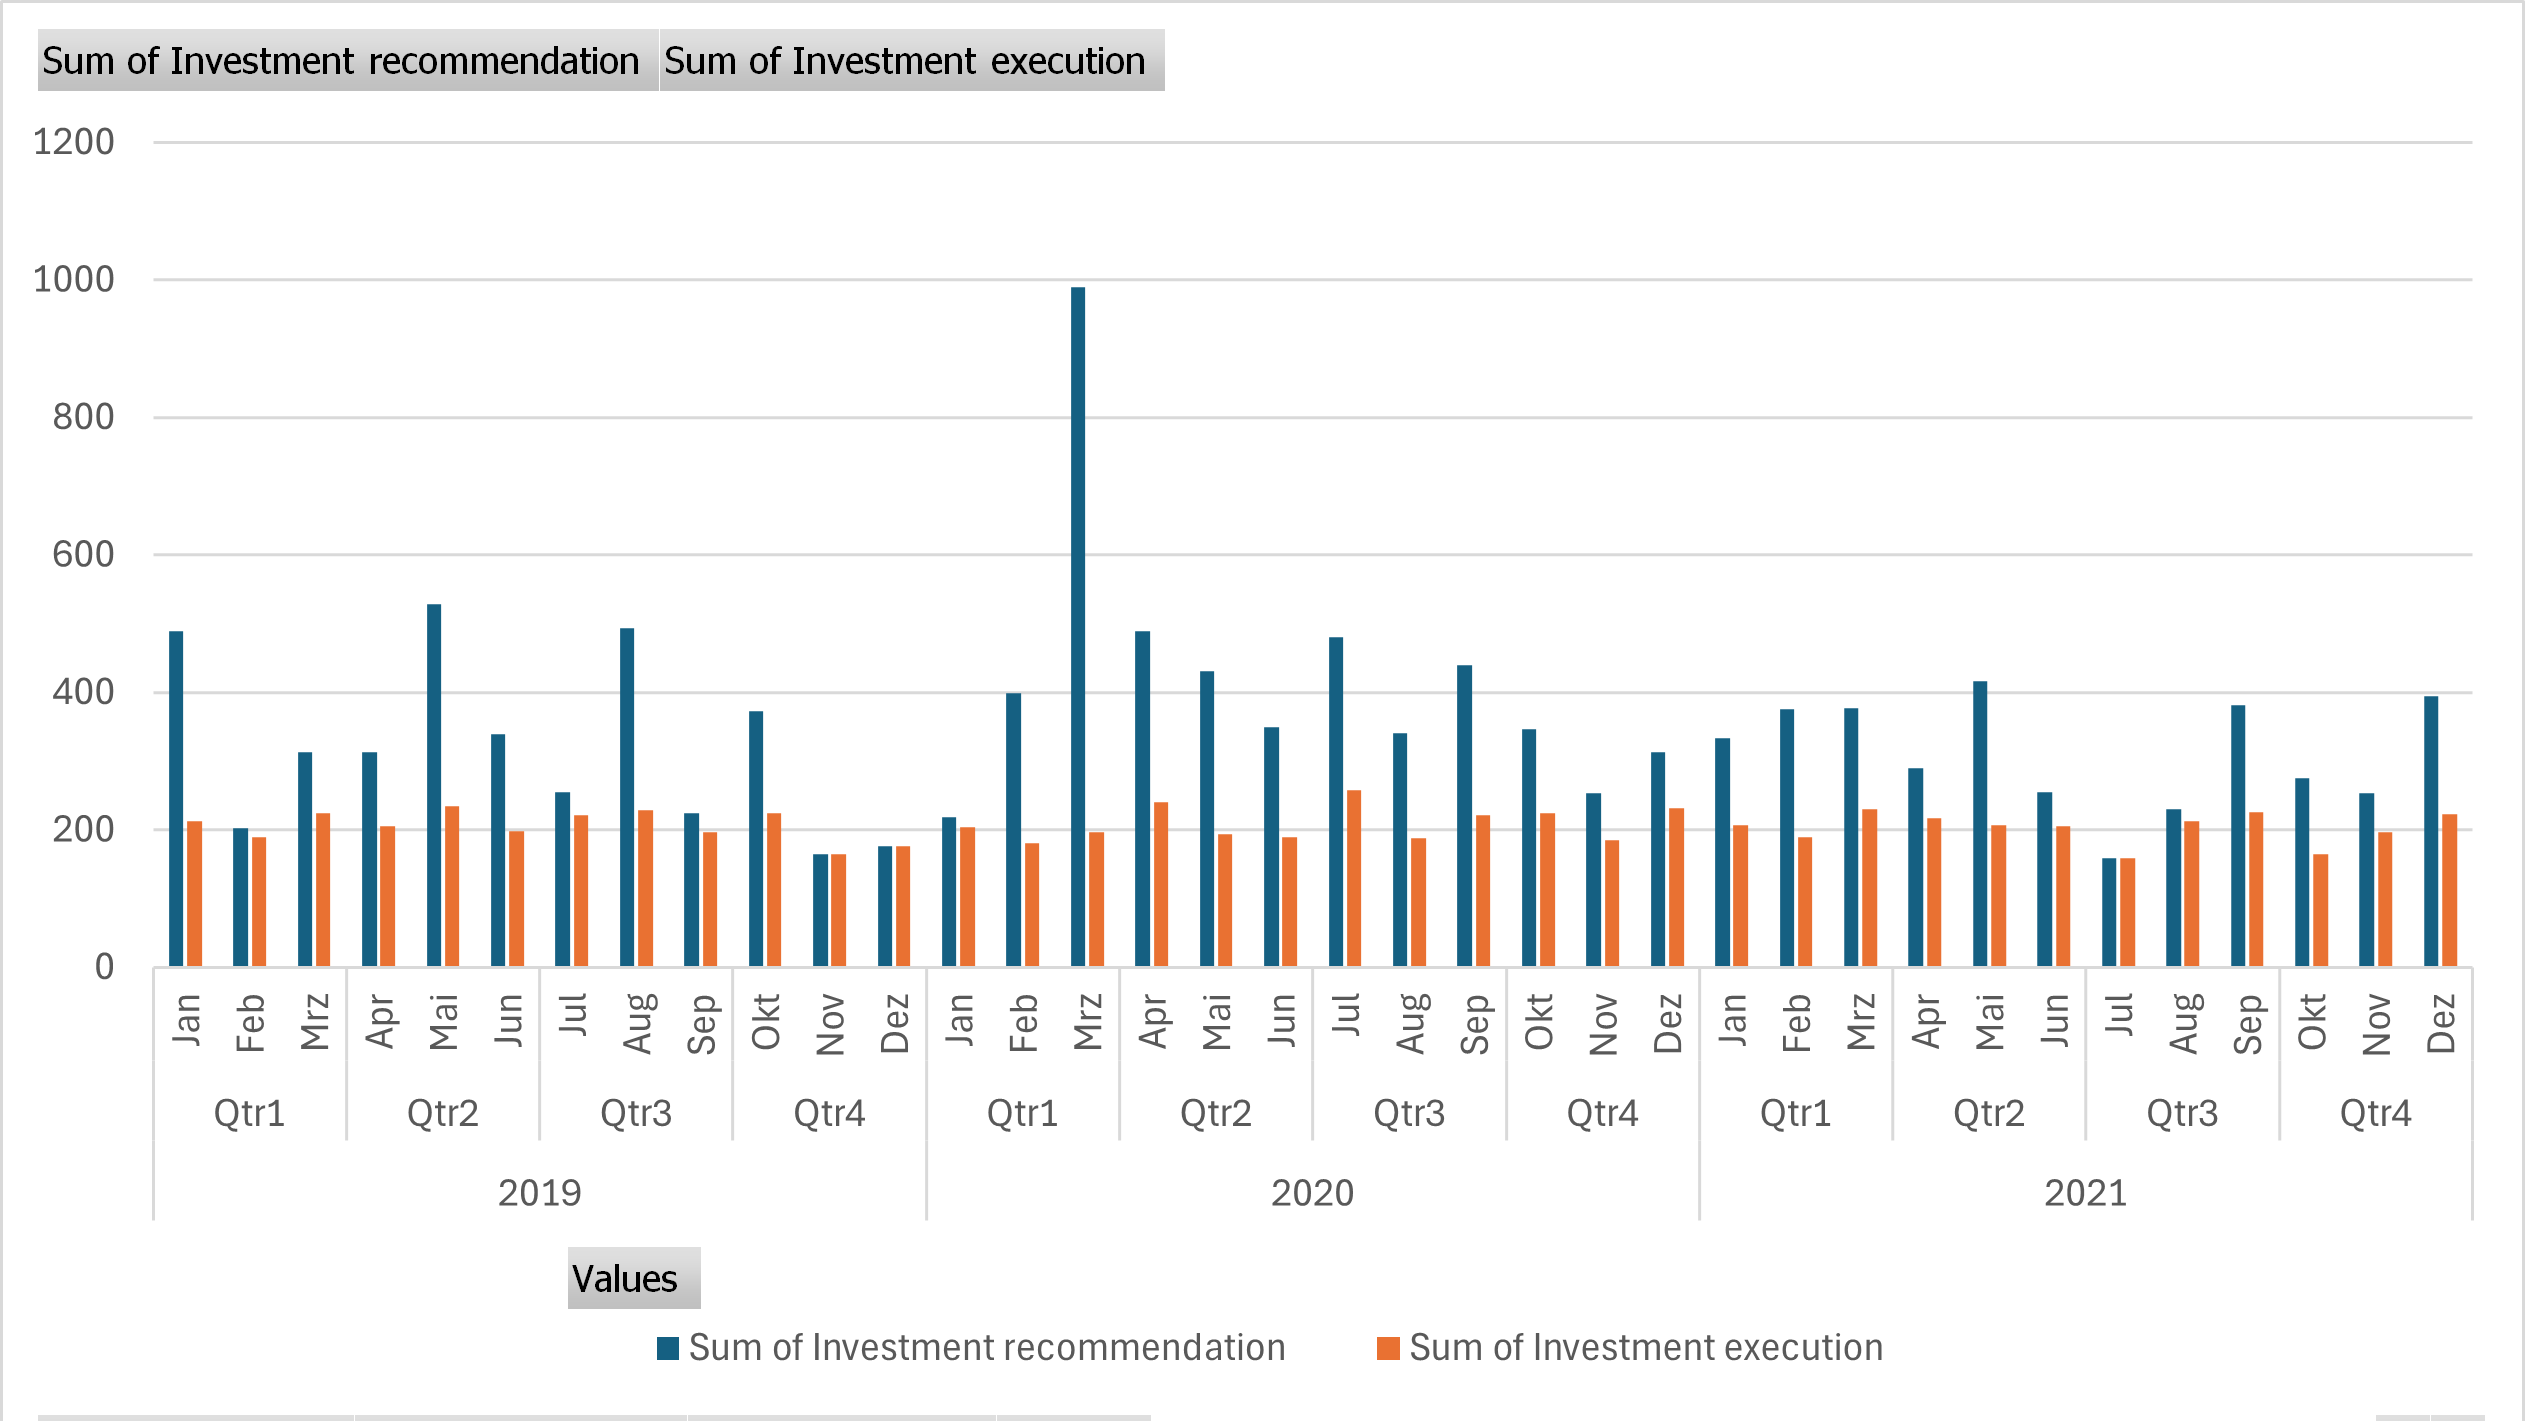
The following graph 4 shows that the number of recommendations varies over time. In some periods there are only few recommendations and in some, there are more. The execution of the recommendation however is pretty stable (only 40% of the recommendations result in a buy), in order to keep the money engaged in the market.
Here is the return of the model:
My Trading-system delivered a compound return of 600% (without transaction fees).
Including 0,1% transaction fees for every trade would still deliver a return of 500%.
Compared to that, the buy-and-hold strategy delivered a compound return of 450%.
(not including tax-effects)
The challenges and surprises
- The most difficult challenge for creating a good model was finding the right input parameters and the right quantity of parameters. Too many parameters are too confusing for the model and don’t add an information benefit to it. Too few parameters don’t give the model enough useful information. An AI model is like a human being. If you give it too much information and too many tasks, it suffers a mental breakdown. If you give it too little information and few tasks, it doesn’t go into the right direction but flounders in its own creative ways.
- The quality of the predictions depend strongly on the period of time into the future. With my model, it is impossible to make predictions for tomorrow, however it started performing better with predicting the prices in 1 week and performed best with predicting the prices in 1 month. Prices farther away in the future were more and more difficult to predict, where prices 1 year into the future didn’t deliver useful results anymore.
- Price data alone was sufficient for training the AI. I didn’t include other data, like financial statements. (I didn’t test a model with fundamental data, however I want to try this in my next analysis)
- Trading Volume deteriorated the performance. Firstly, I wanted to further improve the model performance by adding trading volume, however the performance decreased, on all attempts with different pre-calculations
- Q-Learning wasn’t useful at all. The results were random. Maybe I didn’t find the right strategy for that.
- Random Forest, Support Vector Regression, Histogram Boosting Regression delivered useful results and the Deep Neural Network performed best (more analysis would be necessary to really find out what works best. Maybe I didn’t find the best settings for the other approaches)
Conclusion
This experiment demonstrates impressively the power of artificial neural networks. Compared to a buy and hold strategy, the out-performance of the trading system is visible. With training-data from the 1980s to the 2000s, the model was able to gain an significant advantage in the market the 2010s.
AI will change the short/medium-term trading significantly and the competition for the best AI-based prediction model has started.
Regarding the future use of my model: Even though the forecasts of the model created an out-performance in the last 10 years, I will not put the model into use, because I am pretty sure my model will under-perform due to more powerful models which are starting to play the market.
Further Information
In this article, I do not go into details, of the experiment and the parameters used for the prediction model and the trading system, however here is an overview of the machine learning methods, I tested:
- Random Forest Regressor
- Histogram Gradient Boosting Regressor
- Support Vector Regressor
- Deep Neural Network
- Q-Learning
- Experiments with variations of the following parameters:
- Batch size
- Neural network layers
- Training epochs
- Input parameter pre-calculations
- Target parameters
- Loss functions
- Token-system:
- Token quantity optimization
Training and test data
100 companies from the S&P500 with daily price data from 1980 to 2024 (The years 1980 to 2011 used for training and the years from 2012 to 2023 used for testing). For better validation of the model, I added failed stocks (Wirecard) and stocks with weird behavior ( Gamestop) to the dataset.
I was very wary about the good results and checked many times for forward-looking-biases and other logical and programming errors. There is none.
